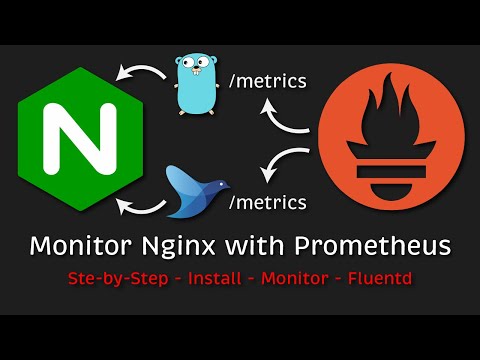
How to Monitor Nginx with Prometheus and Grafana? (Step-by-Step – Install – Monitor – Fluentd)

Monitor Nginx with Prometheus, Grafana and Fluentd.
👉 How to Manage Secrets in Terraform – https://youtu.be/3N0tGKwvBdA
👉 Terraform Tips & Tricks – https://youtu.be/7S94oUTy2z4
👉 ArgoCD Tutorial – https://youtu.be/zGndgdGa1Tc
💼 – I’m a Senior Software Engineer at Juniper Networks (11+ years of experience)
📍 – Located in San Francisco Bay Area, CA (US citizen)
🤝 – LinkedIn – https://www.linkedin.com/in/anton-putra
🎙 – Twitter – https://twitter.com/antonvputra
📧 – Email – [email protected]
👨💻 – GitHub – https://github.com/antonputra
=========
📚 – Source Code: https://antonputra.com/monitoring/monitor-nginx-with-prometheus/
0:00 Intro
3:05 Install Nginx
5:02 Expose Basic Nginx Metrics
6:29 Install Nginx Prometheus Exporter
8:13 Install Prometheus
10:29 Install Grafana
12:26 Install Fluentd
14:54 Create Simple Flask App
#Nginx #Prometheus #DevOps
Comments are closed.