Graphing Exponential Functions With e, Transformations, Domain and Range, Asymptotes, Precalculus
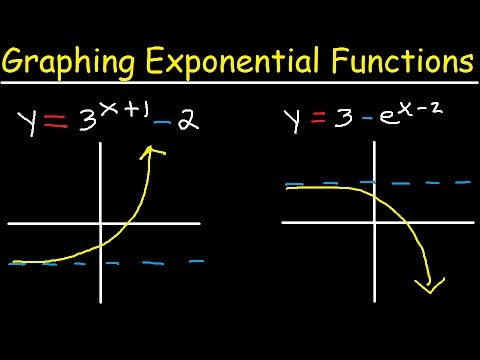
This algebra 2 and precalculus video tutorial focuses on graphing exponential functions with e and using transformations. It explains how to find and write the domain and range of the function in addition to identify the horizontal asymptote. It shows you how to use a data table to plot at least two points to draw an accurate sketch of the graph. This video contains plenty of examples and practice problems.
My E-Book: https://amzn.to/3B9c08z
Video Playlists: https://www.video-tutor.net
Homework Help: https://bit.ly/Find-A-Tutor
Subscribe: https://bit.ly/37WGgXl
Support & Donations: https://www.patreon.com/MathScienceTutor
Youtube Membership: https://www.youtube.com/channel/UCEWpbFLzoYGPfuWUMFPSaoA/join
Disclaimer: Some of the links associated with this video may generate affiliate commissions on my behalf. As an amazon associate, I earn from qualifying purchases that you may make through such affiliate links.
Comments are closed.