Skip to content
53GB
Free system video tutorial
Home
script
Software
Server
Back end
SQL
Network
Computer
GPT
Other
Privacy Policy
Menu
Grafana
SQL
Business Dashboards with Grafana and MySQL
1 year ago
SQL
Using MySQL to Create a Grafana Dashboard
1 year ago
Other
Game In RUST Multiplayer Server In GOLANG
1 year ago
script
Building A Low Latency Game Server In Golang
1 year ago
Network
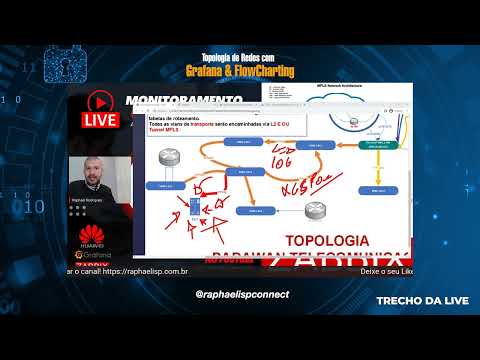
Monitorando OLT Intelbras Gpon 8220I e Epon 4840E com Zabbix e Grafana | Sinal Óptico Rx (BEE 2023)
1 year ago
script
Go (Golang) vs Rust: The Ultimate Performance Battle
1 year ago
Server
Learn Kubernetes this way Lesson 1 featuring Manifests
1 year ago
Network
Monitoramento OLT GPON e XGSPON com SNMP Zabbix e Grafana
1 year ago
Network
Criando planos para rede GPON XGS-PON
1 year ago
Network
Criando Profiles OLT huawei para rede GPON XGS-PON
1 year ago
Server
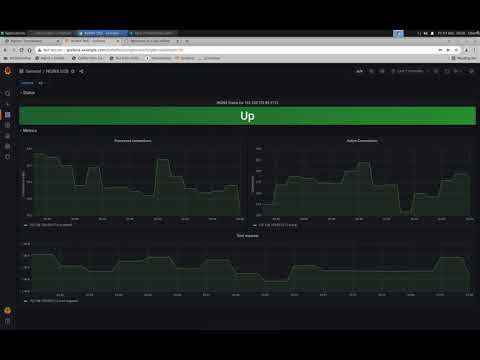
Monitoreo de Aplicaciones con NGINX Plus (KIC) , Prometheus y Grafana
1 year ago
Back end
Magic JavaScript trio for Grafana | Dynamic Text, Data Manipulation and Apache ECharts plugins
1 year ago
Server
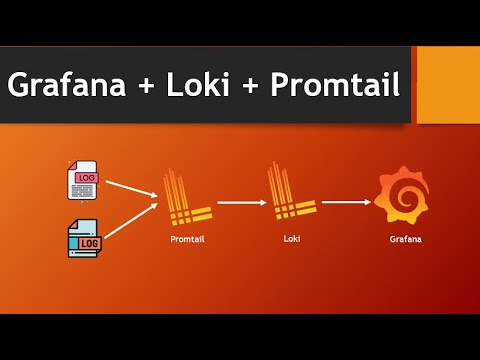
Grafana Loki Promtail | Grafana Loki Setup And Configuration On CentOs
1 year ago
SQL
Apache Hop User Meetup Vol. 3 – Apache-Hop als ETL-Tool für einen BI-Stack
1 year ago
SQL
How to tell the story with Grafana dashboard | Apache ECharts, Bar Chart, Logs, Heatmap tutorial
1 year ago
Network
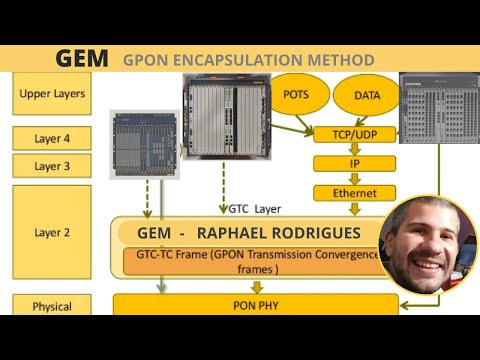
GEM – Método de encapsulamento GPON
1 year ago
Network
#live Planejando a implantação de OLT GPON ou XGS-PON
1 year ago
Network
Apresentação BOOTCAMP Operações e Monitoramento de OLTs GPON
1 year ago
Network
O segredo do GPON XGS-PON o futuro
1 year ago
Server
Grafana Installation – nGINX | Ubuntu 20.04 LTS | SSL | Telegraf | VictoriaMetrics | Letsencrypt
1 year ago
SQL
PostgreSQL with Timescale in Grafana | Ultimate storage partner
1 year ago
script
Go (Golang) vs Node JS (Microservices) performance benchmark (Istio – Prometheus – Grafana)
1 year ago
Server
Monitoreo Servidor Nginx – Telegraf – InfluxDB y Grafana
1 year ago
SQL
Enhance Grafana performance with MySQL Database Service and Heatwave – Ivan Tu [Mandarin]
1 year ago
SQL
Custom MySQL Time Series Queries in Grafana 6
1 year ago
SQL
Como monitorear PostgreSQL con Grafana, Prometheus y Docker
1 year ago
SQL
8 PostgreSQL Extensions You Need To Know About
1 year ago
Other
Introduction to Cloud Computing | සිංහලෙන්
1 year ago
script
How to Set Up Prometheus & Grafana: Monitoring an API with Golang
1 year ago
SQL
How to connect Grafana to a remote MySQL database
1 year ago
Posts navigation
Previous
1
2
53GB.COM
GPTSTORE
CPU
Yougpt
Gptsio
Gpt-store-Nav