Working with time series data in Node Red with SQLite
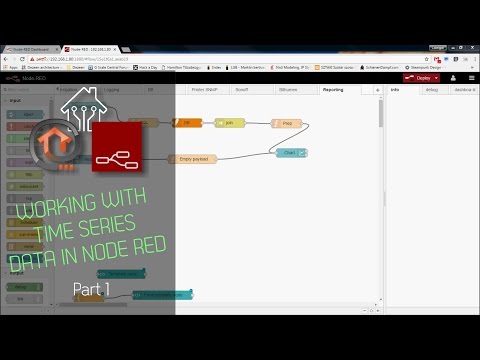
This video is going to be a first in a series on how to collect, display and aggregate time series data in Node Red.
In this video I am using SQLite to store data, phpLiteAdmin for the basic database administrative activities.
I discuss a few topics in this video:
1) How to store multiple data points in the table: generate multiple INSERT INTO
2) Back up dashboard graph state to a file and restore on startup.
3) Example on how to aggregate data stored in database: get max, min and last values daily and store aggregated values separately.
4) Generate graphs from values stored in the database using multiple data points in a single graph.
Flows shown in the video are available here:
http://flows.nodered.org/flow/36f2de38ed4bb62cf3a5e8fdc76d779e
Create SQL commands:
CREATE TABLE ‘sensor_aggr’ (‘epoch’ INTEGER NOT NULL, ‘device’ TEXT NOT NULL, ‘sensor’ TEXT NOT NULL, ‘value’ REAL, PRIMARY KEY (‘epoch’, ‘device’, ‘sensor’))
CREATE TABLE ‘sensor_data’ (‘id’ INTEGER PRIMARY KEY AUTOINCREMENT NOT NULL, ‘device’ TEXT, ‘sensor’ TEXT,’value’ REAL,’epoch’ INTEGER, ‘timestamp’ INTEGER DEFAULT CURRENT_TIMESTAMP)