Ethereum (ETH) to USDT chart over the 1-day timeframe 18/3/2023 #shorts
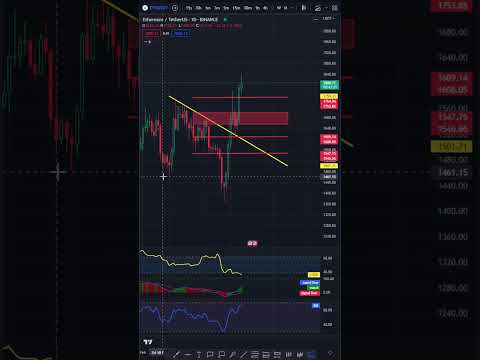
Hello everyone, let’s look at the ETH to USDT chart on a single day time frame. As you can see, the price is moving above the local downtrend line. Let’s start with the support line and as you can see the first support in the near future is $1755
What is CryptoDaily?
The leading crypto and blockchain news site that ‘BRIDGES’ the gap between companies, users, and enthusiasts. Powered by a ‘symbiotic hybrid model’
Subscribe, Like, Follow, and Comment on all our Channels below:
Our website: https://cryptodaily.co.uk
First channel with news: https://www.youtube.com/@cryptodailyofficial
Facebook: https://www.facebook.com/officiallycryptodaily
Twitter: https://twitter.com/cryptodailyuk
Telegram: https://t.me/officialcryptodaily
Instagram: https://www.instagram.com/cryptodailyofficial
Tik Tok: https://www.tiktok.com/@cryptodailychannel
Twitch: https://www.twitch.tv/cryptodailyofficial
Discord: https://discord.gg/ZXUp5EZ2an
Disclaimer: This Video is for informational purposes only. It does not reflect the views of Crypto Daily, nor is it intended to be used as legal, tax, investment, or financial advice. Trading cryptocurrencies poses a considerable risk of loss
#crypto #shorts #bitcoin #cryptocurrency